How Do I Check My Design?
Plandroid has two ways of doing automatic checking of your design - a quick check toolbar button, and a more involved and complete detailed design checker.
Quick Checks
You can use the Check Design toolbar button ( , or press C) to quickly perform a visual check of a number of common issues in the design canvas. Which checks are performed are determined by the active tool-tab. If you are in the Loads tab, then issues with your loads are highlighted. If you are in the Parts tool-tab, then only unconnected connectors are highlighted. If you are in any other tool-tab, both the connectors and the loads are checked and highlighted.
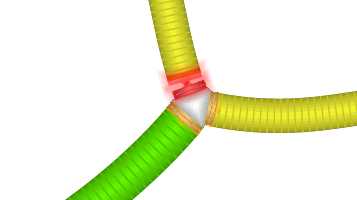
In the Loads tab, the tool will highlight zones to indicate if their air flow is adequate. Zones outlined in green have sufficient air, those outlined in yellow have almost sufficient air, and those outlined in red have insufficient air. If you want to re-check a modified design and are using the analytical
airflow solution (which can take a significant length of time to solve), you have to manually
use the Solve Air Flows tool
( ) to recalculate the airflows. The results shown will be those
from the last air flow solution performed, even if your design has since changed. If you are using the (faster) simplified airflow solution,
the airflows will be recalculated every time you check your design.
) to recalculate the airflows. The results shown will be those
from the last air flow solution performed, even if your design has since changed. If you are using the (faster) simplified airflow solution,
the airflows will be recalculated every time you check your design.
Note that even the analytical air flow calculations performed by Plandroid are somewhat simplified and you should perform your own analysis if you require a more detailed solution.
In the Parts tab, the tool will make any connections that are not yet joined light up in red to show you where your design may be unfinished.
Detailed Checks
To do a more detailed design check you can use the built-in design checker tool, that can give you feedback on the state of your design and give you guidance on how to make corrections. It pays to keep an eye on your design status so that you can address any issues as they come up. The design checker will show the current state in the status bar (good, warnings, or errors) by the buttons in the bottom right of the status bar.

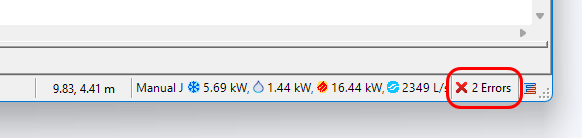
Click on the design checker to get a detailed report. The tool will display all the design issues - warning or errors - that have been identified in your design.
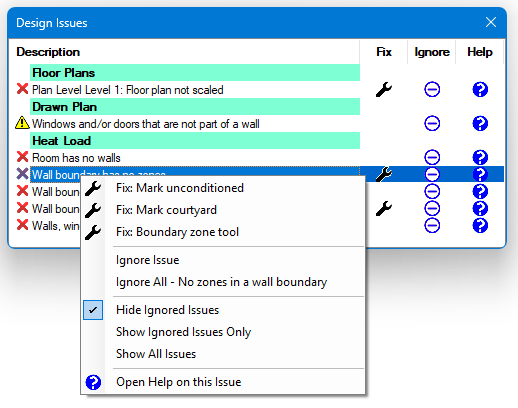
Clicking on the issue itself in the tool will take you directly to the object in the canvas that requires your attention. Open the context menu on any issue with a right-click to see what options are available in each case. You have the option to directly apply a fix if one is available, to ignore the issue which cancels the message, or to open the appropriate Help documentation on the item.
Issues that you have ignored will be saved in your save file for that design.
The detailed design checker is especially useful when you are doing a material-based heat loads design. In this case there can be many things that you need to remember to specify to get a correct design, and the design checker is very helpful at making sure you get everything right.